How to Use Digital Classroom Analytics to Predict Student Performance

In the typical Indian school ecosystem, academic data is almost always a retrospective review. You administer a unit test, you evaluate the papers, and then, weeks after the lesson was taught, you realize that 40% of Class 9B struggled with the module on Trigonometry.
By the time this data hits the Principal’s desk, the opportunity for timely correction has often passed. The learning gap has formed, the syllabus has moved on to the next chapter, and the teacher is forced into a cycle of playing catch-up. This is the Rearview Mirror problem: driving our schools by looking exclusively at where we have been, rather than where we are going.
This is where the distinction between a simple projector and a holistic digital classroom becomes critical. A true digital solution, like Roombr, doesn't just display content. It functions as a continuous diagnostic engine. By treating your smart board for classroom interaction as a live data point rather than just a digital chalk mark, you can shift your institution from reactive reporting to proactive intervention.
Here is a deep-dive into how you can use the predictive analytics of a modern digital ecosystem to forecast student performance and secure success before the final exam.
How a Digital Classroom Predicts Performance
1. The Hesitation Metric: Correct Answers Can Be Misleading
Traditional assessment models are binary: the student is either right or wrong. However, in the cognitive science of learning, a correct answer derived from mastery is vastly different from a correct answer derived from guessing.
In a standard classroom of 40 students, it is nearly impossible for a teacher to measure the confidence gap of every individual simultaneously. But a digital classroom running advanced software can do that.
When a teacher runs a formative assessment or a quick poll via the interactive interface, the software captures a hidden, high-value metric: Time-to-Response.
- The Scenario: Two students, Rahul and Ananya, both answer Option B correctly on a Physics question. On the final grade sheet, their performance looks identical.
- The Data Reality: The analytics reveal that Rahul answered in 4 seconds with a single click. Ananya took 45 seconds, selected Option A, erased it, and then finally switched to Option B.
- The Prediction: The software flags Ananya as At-Risk for this specific topic. While she secured the marks today, the hesitation indicates a lack of conceptual clarity. The system predicts that under the high pressure of a board exam, Ananya is statistically likely to make an error on this topic.
This is a prime example of the importance of AI in education. It isn’t about replacing the teacher. It's about providing algorithms that can hear the hesitation that a human teacher might miss in a busy room. By filtering your dashboard to show slowest correct responses, you can identify students who are masking their confusion with luck.
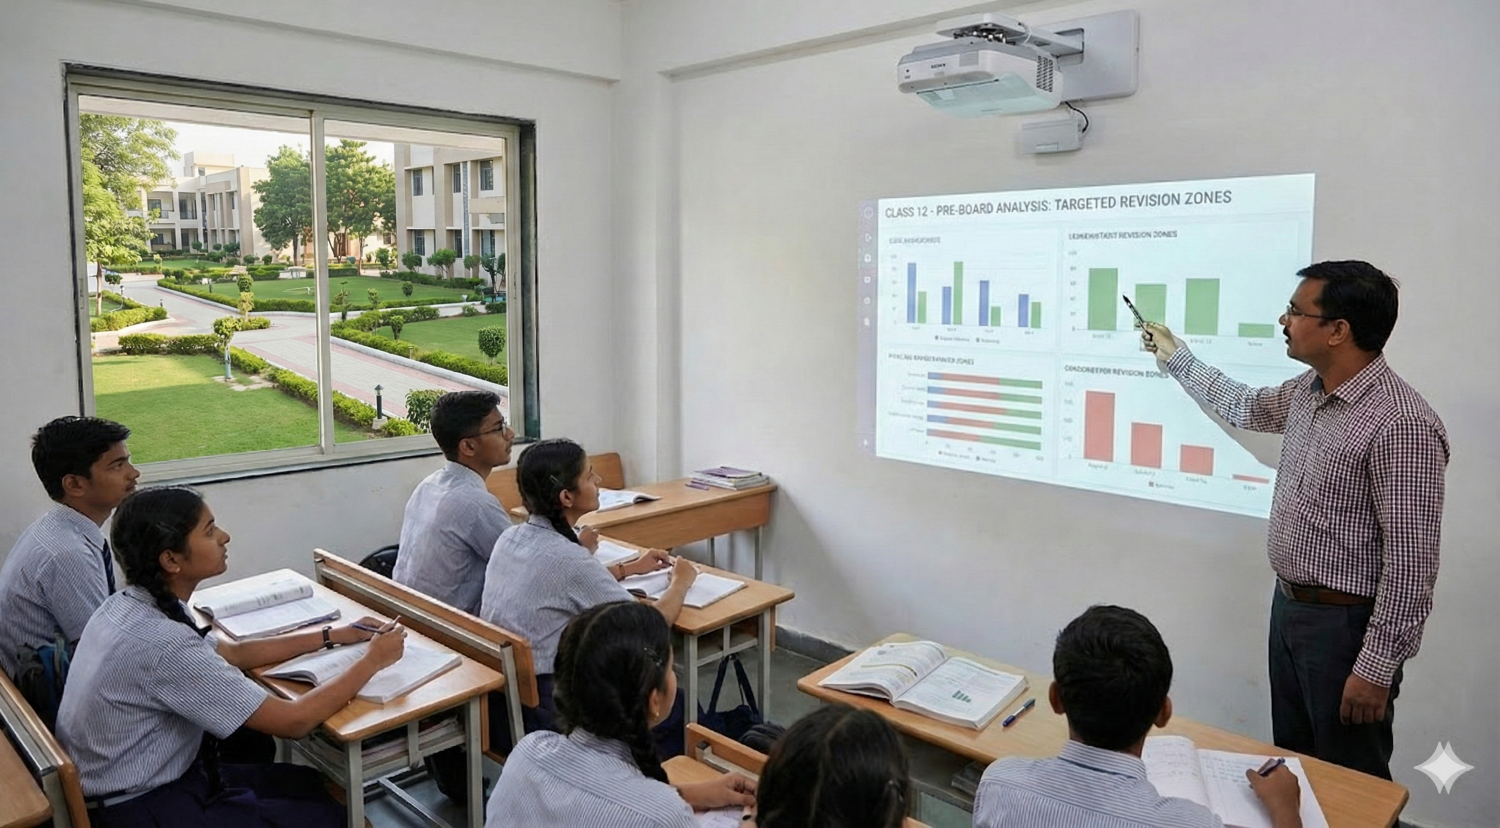
2. The Revision Heatmap: Forecasting Curriculum Hurdles
One of the most underutilized features in Indian EdTech is the consumption data from recorded lectures. Lesson Capture feature automatically records, indexes, and organizes classroom sessions for students to review at home.
Most administrators only check if students are logging in. However, the true predictive insight lies in what specific segments they are watching.
Imagine your analytics dashboard shows a Heatmap Spike. The data shows that 75% of the 10th-grade class went back to watch Tuesday's Chemistry recording. More specifically, the data shows they all scrubbed the video timeline to repeatedly watch the segment between 12:15 and 14:30.
- The Prediction: This is a clear signal of a curriculum hurdle. If the majority of the class is re-watching the same 2-minute explanation, it predicts that the in-class teaching method for that specific concept (e.g., Covalent Bonding) was insufficient for the group.
- The Action: Armed with this data, the HOD can advise the teacher to re-teach that specific concept the very next day, perhaps using a 3D simulation instead of a diagram. You bridge the gap before the unit test reveals a widespread drop in scores.
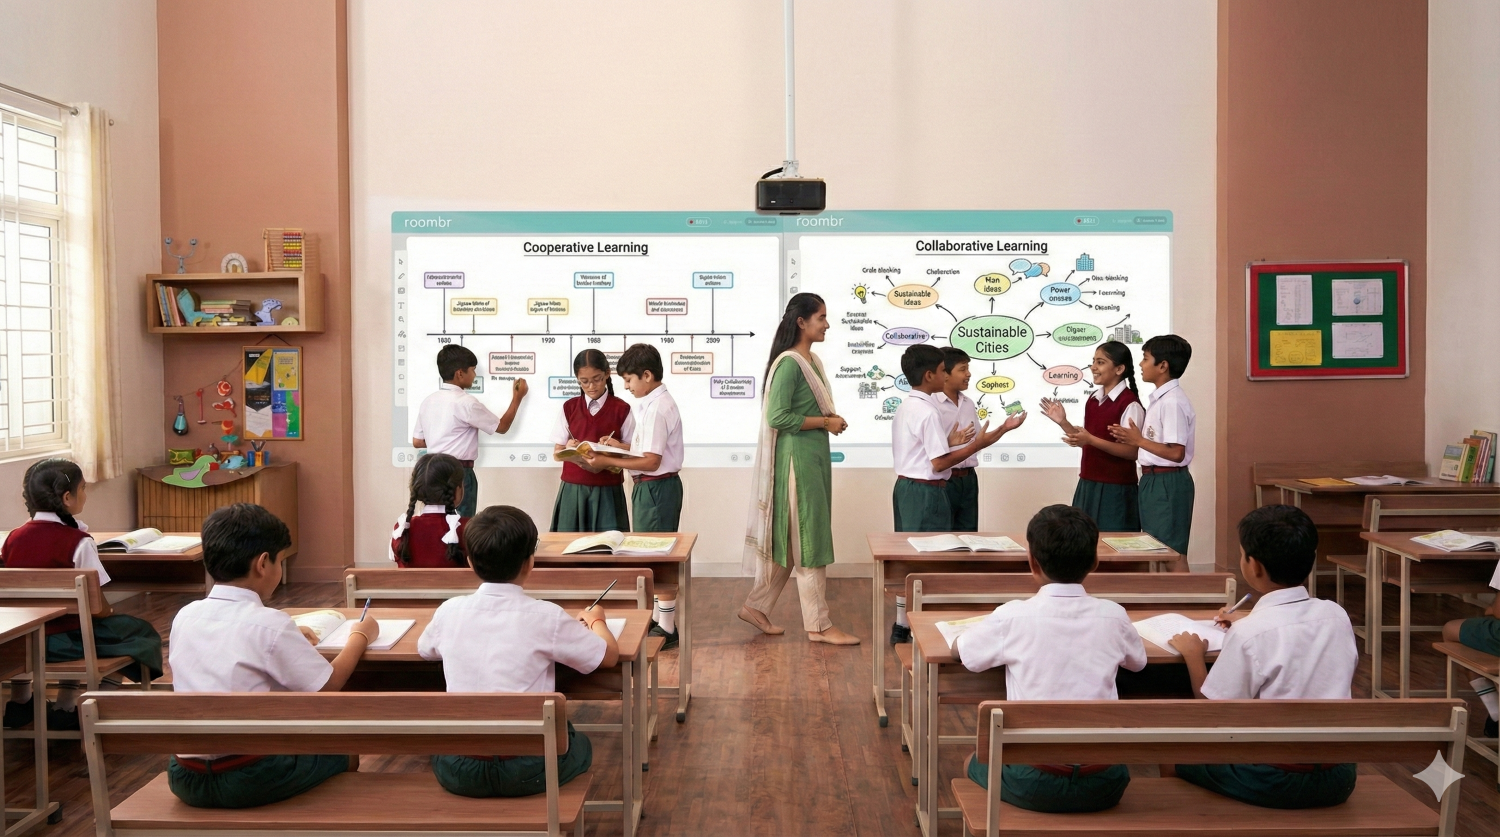
3. Decoding Collaborative Learning Data
Collaborative learning is often a difficult metric to track. You put students in groups to solve a problem on the interactive display, but traditionally, you have no way of knowing who did the heavy lifting and who was simply a passenger.
A robust digital classroom solution changes this by assigning unique digital identities to student interactions. When students work on the digital canvas, the software tracks individual contributions to the group project in real-time.
- The Insight: You might identify a scenario where one student inputs nearly all the meaningful data, while the rest of the group limits their engagement to minor adjustments or using the eraser.
- The Prediction: Students Y and Z are passively disengaging. Despite the group getting a high grade, these individual students are at risk of falling behind when they have to perform solo. This allows teachers to intervene and restructure groups to ensure accountability, ensuring that every student is developing the necessary skills.
4. Predicting Engagement Drop-off
In a physical classroom of 50 students, the quiet student is the easiest to overlook. They don't cause disruptions, they hand in homework, and they fade into the background. These are often the students who struggle unexpectedly.
In a digital ecosystem, silence is a loud data point.
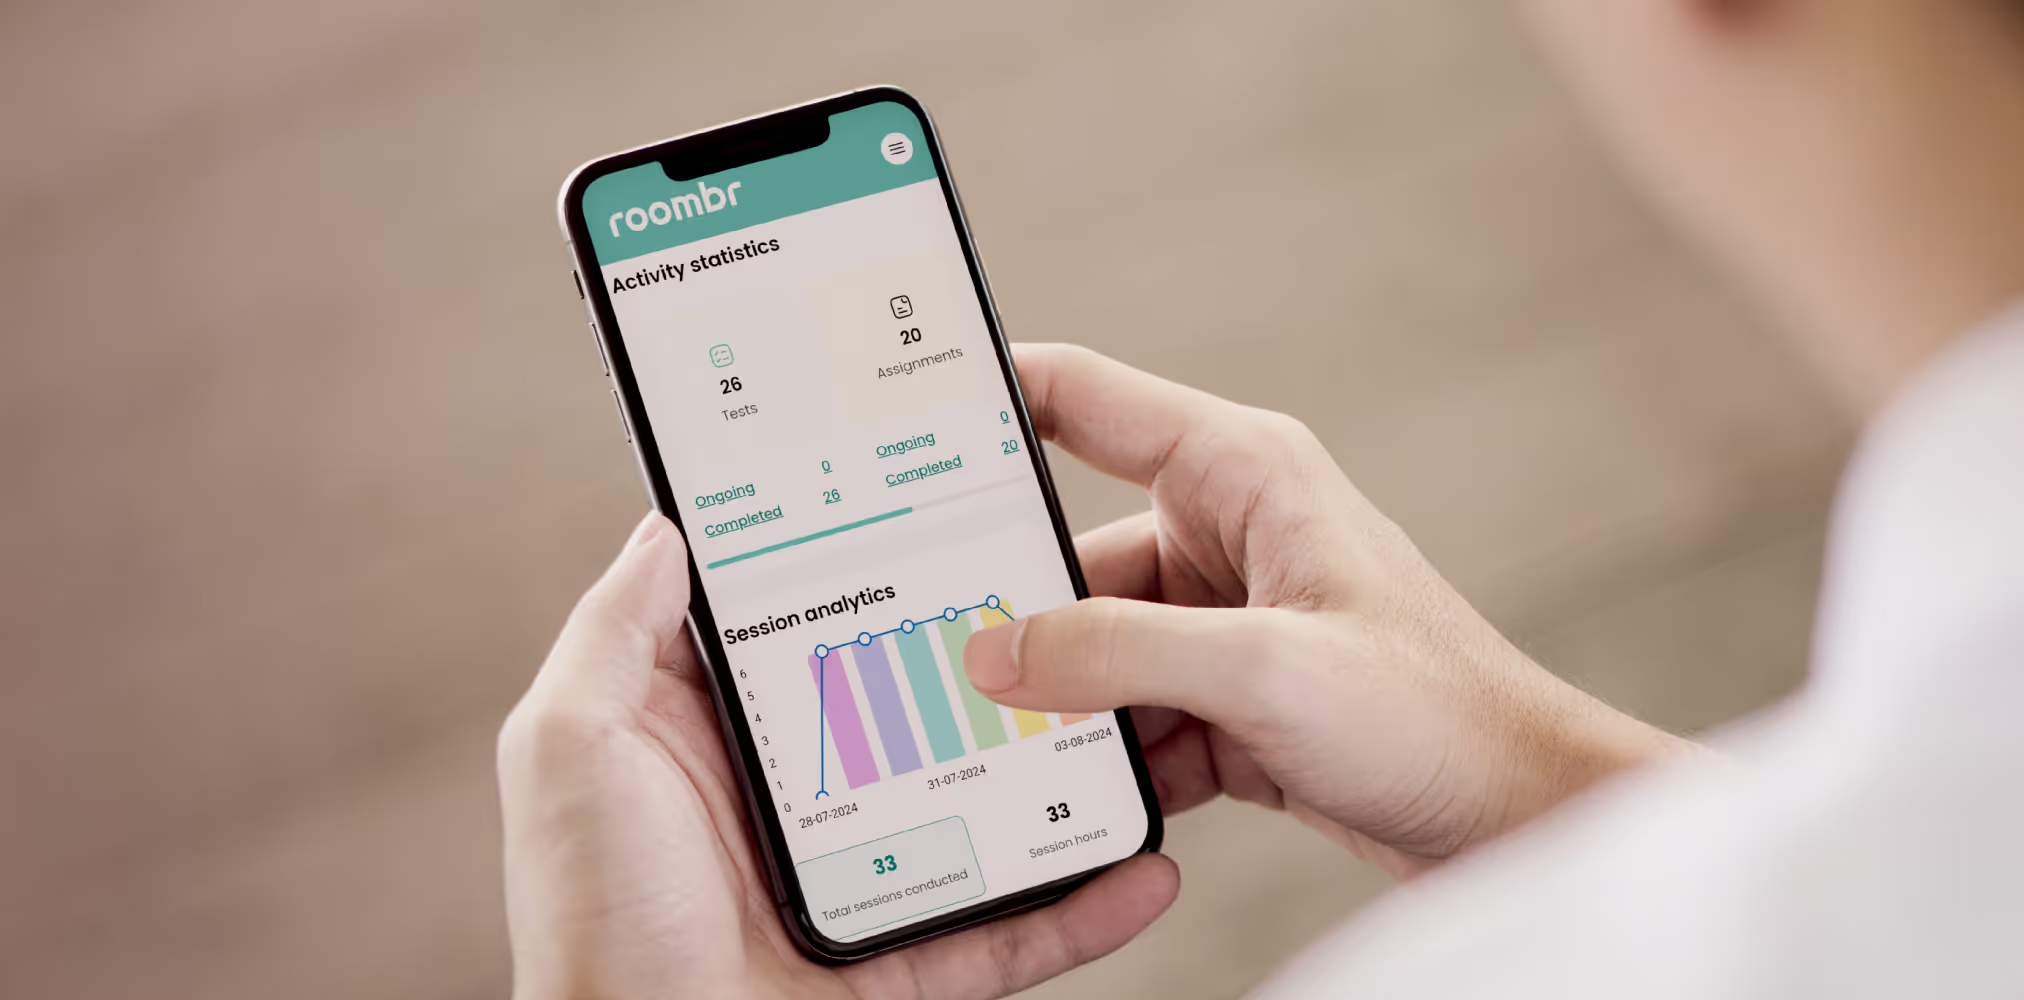
An advanced integrated system tracks engagement across the spectrum—poll participation, access to the content library, and interaction with 3D models. The most dangerous predictive signal in your dashboard is not a bad score; it is a missing score.
- The Prediction: If a student’s interaction rate (a composite score of clicks, views, and responses) shows a 15% week-over-week decline, the system predicts a high probability of future absenteeism. This digital silence is often an indicator that precedes physical absenteeism by about two weeks.
- The Action: A teacher can have a conversation with the student (I noticed you haven't accessed the library this week) long before the student actually stops coming to school.
5. The End Goal: True Personalized Learning
The ultimate goal of collecting this granular data is not to police students, but to enable personalized learning at scale—something that has been historically impossible in India's high-density classrooms.
By using predictive analytics, the digital classroom automates the diagnosis. It tells the teacher who is struggling and why, allowing the educator to prescribe specific remedial content from the library.
For example, instead of assigning extra homework to the whole class, the teacher can click a button to assign a Basics of Calculus video module only to the five students whose Hesitation Metric was high during the lecture. This ensures that advanced students aren't bored, and struggling students aren't overwhelmed.
Key Takeaway
The transition from a traditional setup to a digital classroom is not just an infrastructure upgrade; it is an intelligence upgrade.
If your school is investing in a smart board for classroom, ask yourself: Is it just a screen, or is it a sensor? Does it just show you what you taught, or does it tell you what they learned?
By leveraging the deep software capabilities of platforms like Roombr, you can stop looking at the grades of the past and start acting as an architect—building a future where every student’s success is predicted, planned, and secured.
Ready to see these analytics in action? Explore the complete Roombr App and digital classroom hardware ecosystem today.

Foziya Abuwala
Share
Step Into the future of
Education with Roombr